Properties of material on a stress-strain diagram
There are some properties of the material that we can understand from the stress vs. strain diagram and load vs. deformation diagram like Elasticity, Plasticity, Toughness, Stiffness, Modulus of toughness, Resilience, Modulus of resilience, Proof resilience, Ductility, Mailability, Brittleness, etc.
Elasticity
- When we applied force or load on solid objects, they will deform and change their dimension. After unloading, the resulting deformation will disappear. This phenomenon of deformed solid object to obtaining its original dimension after unloading is known as “Elasticity”.
- The recovery after unloading is partial or complete, gradual or sudden. If this recovery is sudden and complete, it is called perfectly elastic. If this recovery is gradual and incomplete, it is said inelastic effects.
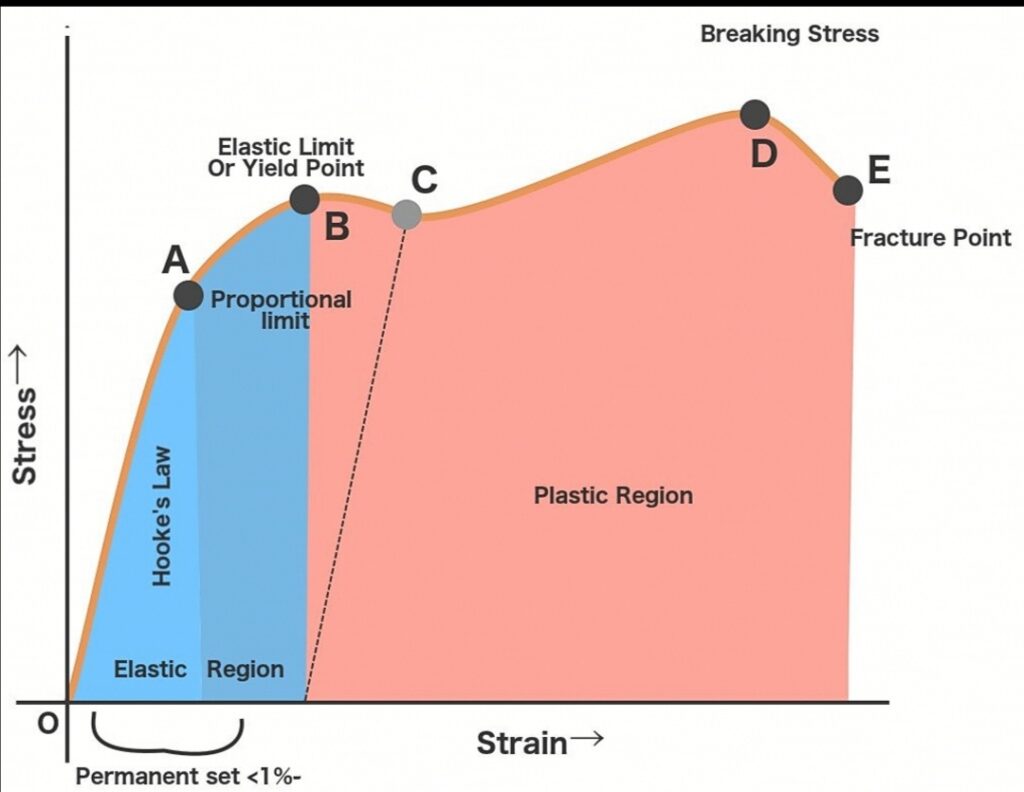
- The line OA shows the elastic behavior of the material, after point B, the material is no longer elastic and starts to become plastic means the material cannot capable to achieve its original dimension that was before loading.
- Here the article gives a better understanding of the stress-strain diagram.
Plasticity
- It is a property of the material in which material may be permanently deformed when it has been subjected to externally applied load or force exceeding the elastic limit.
- Plasticity is a very important property considered in manufacturing processes like rolling, forging, spinning, etc. other processes where material shape change is needed.
- On a fig-1, After point B, plastic deformation starts in the material and the material is no longer elastic after point B.
Stiffness (Modulus of elasticity)
- The load required to cause elastic deformation or resistance against elastic deformation is called the stiffness of that material. If the material has higher stiffness then more amount of load is required to elastically deform it.
- The below image shows different properties of the material. The sloop of line OA is known as stiffness (Modulus of elasticity)

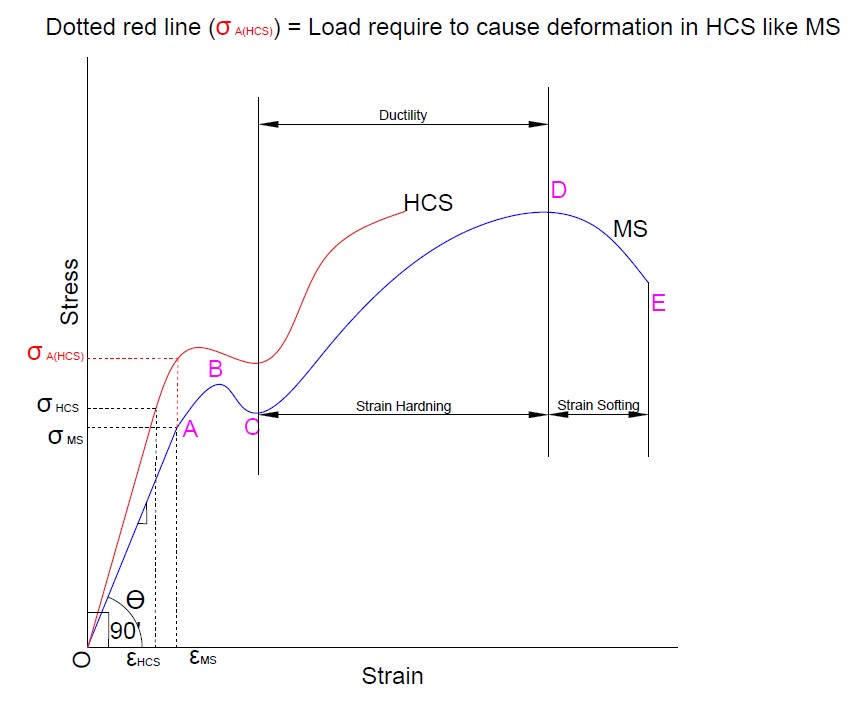
- Consider two materials, High carbon steel, and mild steel. Their stress-strain diagram is plotted on the same graph. We can see that if the angle of line OB (ϴ) moves towards 90’. In the case of High carbon steel (HCS), we get a steeper slope compared to mild steel.
- Hence, we conclude that High carbon steel (HCS) is more stiffer than mild steel. Based on the diagram for HCS, For the same value of stress, less deformation will occur. To cause deformation in HCS like mild steel, we will require more amount of load as indicated on the diagram by the red line.
People also search – Types Of Welding Position (Flat, Horizontal, Vertical, Overhead, 1G 2G 3G 4G 5G 6G welding position
Ductility
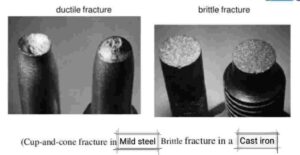
- The higher degree of plastic deformation under the action of tensile load without fracture or failure is called the ductility of materials. Now, ductile failure means, suppose we want good quality smooth wire by drawing from a bar. During the drawing operation, if there are some necking or cracks occurs on a surface of the wire, then it can be said that it has a ductile failure
- In the above fig-2 diagram, the region between point C (Yield point) and D (Ultimate point) indicate material ductility. Wider the region, the material has good ductility and can be able to draw in long products without cracks.
Strain Energy
It can be defined as ‘Energy stored in a member during or due to work done. The formula of strain energy is U = ½( P x δL )
Assumptions for strain energy equation:
- This equation is valid for load/stress within a limit of proportionality. After that, it is not valid
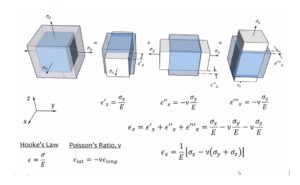
- The material follows Hook’s law
- In the case of UTM ( Universal testing machine), stretching of dogbone specimen between jaws is refers as work done and during testing, some energy stored in a specimen at the molecular level that can be released after releasing strain energy and material regains its original shape or size.
- The area under the σ-ε diagram up to proportional limit represents strain energy per unit volume. If we plot the same graph on the load-deformation diagram up to the proportional limit, it will give only strain energy. Based on that we can determine Resilience, Proof resilience, and Toughness.
Toughness
- Toughness is maximum energy absorbed before fracture. From the diagram, the area under the σ-ε diagram up to fracture indicates energy absorbed per unit volume. That is known as the ‘Modulus of toughness’.
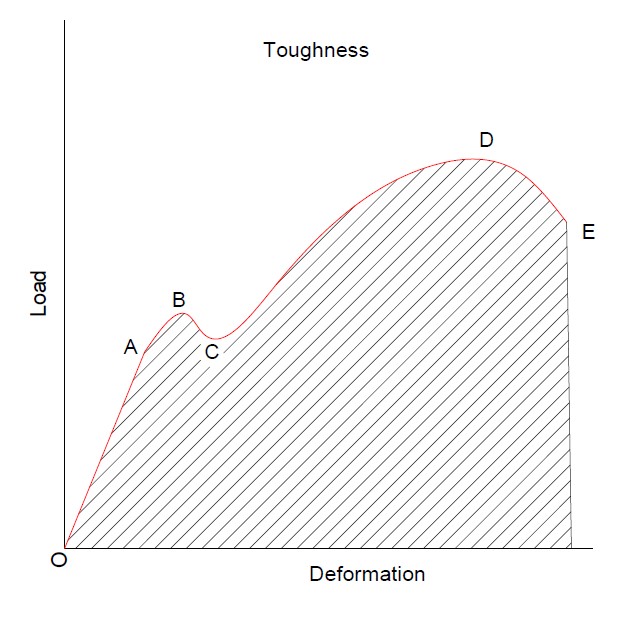
If we plot the same thing on P-δL (Load-Deformation) diagram up to fracture point, it shows energy absorbs up to fracture called ‘toughness’
- Toughness should be considered in the design of components where it is subjected to permanent or plastic deformation due to impact loads acting on a member.
Resilience & Proof resilience
- Resilience is defined as the energy absorption capacity of material in the elastic region when the component is deformed under the action of load. Materials with high resilience are well suited for application where plastic deformation is to be avoided. On a fig-1 (see first above image), The area under point B (up to an elastic limit) on a σ-ε diagram shows maximum energy absorption capacity per unit volume in elastic region (blue region) is called ‘Modulus of Resilience’
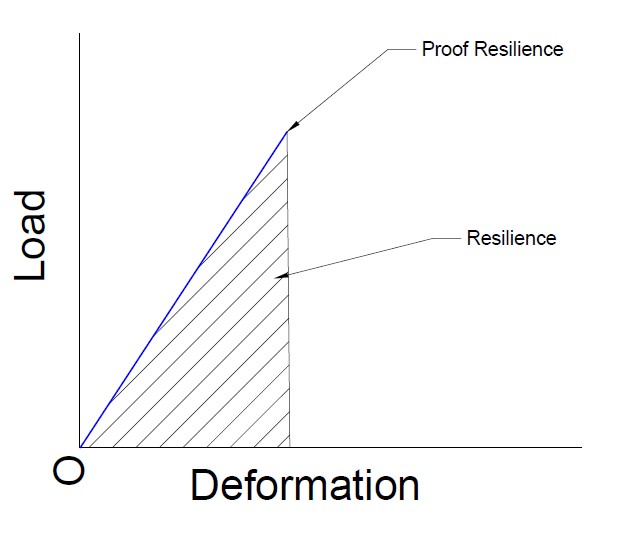
If we plot the same thing on the P-δL diagram, it gives a value of ‘Proof resilience’.
Proof resilience is defined as the maximum energy absorption capacity of material in the elastic region.
- Resilience and toughness are the important properties of material where it is subjected to impact loading or sock loading
- Resilience should be considered in the design of components where it is subjected to high elastic deformation due to impact loads acting on members.
Strain hardening
- When we apply tensile load to a body then it will plastically deform. Then the body will try to come in its original position. But it will not come because of its plasticity. Hence internal forces will be set up in the body which will give additional strength and hardness to the body. It is called work or strain hardening.
- On a diagram, the region between point C (Yield point) and D (Ultimate point) indicate strain hardening.